How attractive is a location to overnight visitors? How well connected is it digitally? And what mobile network technology is available locally?
With three new maps, IZ Research is expanding its ‘Maps’ section to include relevant information on tourism, broadband availability and mobile network coverage. This is not just about providing additional data, but above all about enabling a more nuanced analysis of locations and a targeted assessment of developments.
The new maps draw on up-to-date and reliable data sources, making complex information at local authority level easy to grasp.
Tourism, Broadband, Mobile Communications: New location data in ‘Three New Maps – Many New Perspectives’
// Tourism Key Figures //
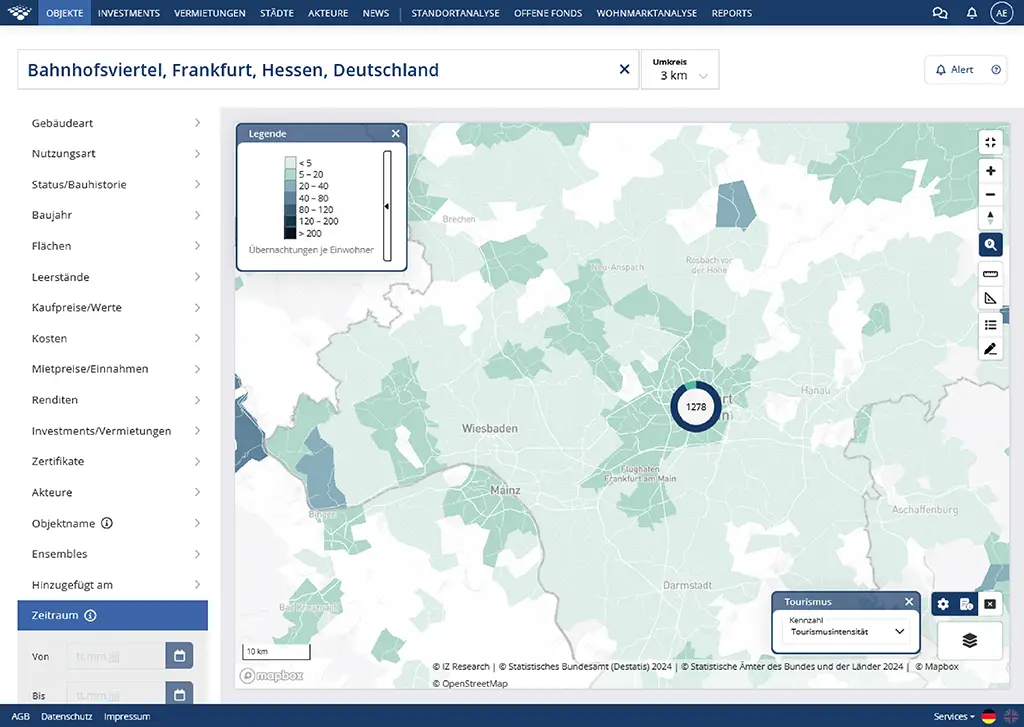
The new ‘Tourism’ map offers several different perspectives on a location’s significance for tourism:
- Visitor arrivals: Number of overnight guest arrivals per year
- Tourism intensity: Overnight stays per inhabitant
- Tourism density: Overnight stays per km²
- Length of stay: Number of nights
- Bed occupancy: Bed occupancy rate as a percentage at local authority level
Visitor arrivals, in particular, provide an important absolute indicator: one arrival corresponds to a visitor checking into an accommodation establishment – regardless of how long they stay. This allows classic tourism hotspots and the actual visitor numbers for a location to be quickly identified.
For a more in-depth analysis, additional indicators such as overnight stays per inhabitant and overnight stays per km² are available, which put visitor numbers into perspective in relation to the population or the area.
Data source: Federal Statistical Office (Destatis), 2024.IZ Research
// Broadband availability //
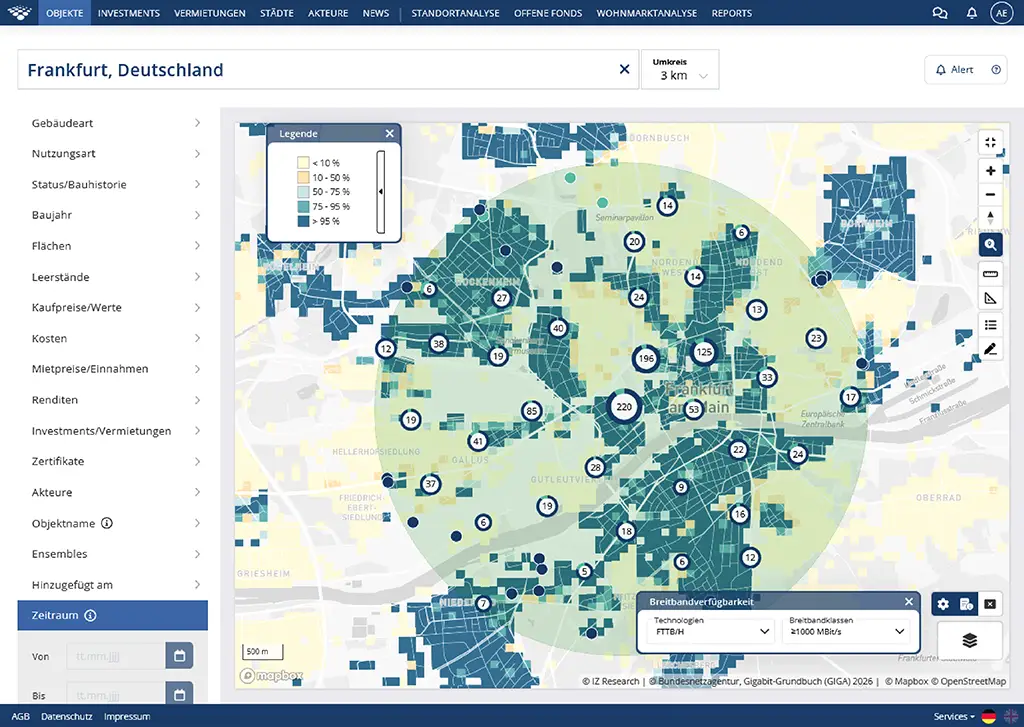
Digital infrastructure has long been a key location factor. The new ‘Broadband availability’ map shows the proportion of private households in a given location that have access to fixed-line broadband internet using the selected technology and download speed.
However, not every broadband connection is the same. To understand the map values, it is therefore worth taking a look at the underlying technologies:
- FTTC (Fibre to the Curb): The fibre-optic cable extends as far as the distribution cabinet. From there, the connection runs via a copper cable into the building. Depending on the infrastructure and vectoring, speeds of up to 50 or 100 Mbit/s are possible.
- FTTB (Fibre to the Building): The fibre-optic cable extends into the building. Inside the building, the connection continues via a copper cable. Speeds of up to 1 Gbit/s are possible.
- FTTH (Fibre to the Home): The fibre-optic cable extends directly into the building or to the household connection. This enables speeds of up to 10 Gbit/s.
Put simply: the closer the fibre-optic cable is to the end user, the higher the available bandwidths tend to be and the greater the potential for a future-proof digital infrastructure. The map therefore not only provides an overview of broadband availability but also – depending on the technology and speed selected – of the quality of a location’s digital connectivity.
The colour gradation shows the respective percentage of private households covered and makes regional differences immediately apparent.
Data source: Federal Network Agency, Gigabit Land Register (GIGA), 12/2025.
Further information: www.gigabitgrundbuch.bund.de
// Mobile network coverage //
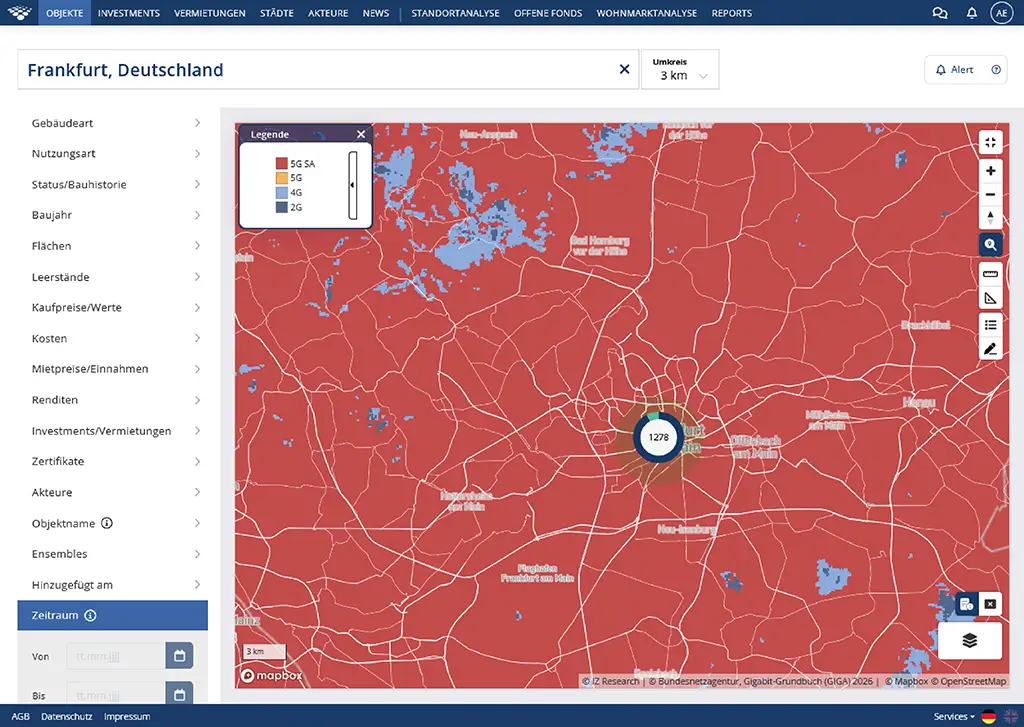
A reliable digital connection is crucial, even when you’re on the move. The ‘Mobile network coverage’ map therefore shows the latest mobile network technology available at any given location.
The technology is categorised according to a clear hierarchy: 5G SA, 5G, 4G and 2G. Where, for example, 5G SA is available, the older technologies can usually also be used.
The map thus complements the broadband information by adding another important aspect of a location’s digital quality.
Data source: Federal Network Agency, Mobile Network Monitoring (MFM), 12/2025.
Further information: www.gigabitgrundbuch.bund.de
What are the benefits of this expansion?
The particular added value of the new maps lies in the interplay of the information they contain. Tourism indicators show just how popular a location actually is. Broadband and mobile network data provide insight into the quality of the local digital infrastructure.
This allows location analyses to be supplemented with perspectives relevant to a range of issues – from assessing potential tourist demand to evaluating the quality of a location’s digital infrastructure.
It is also worth taking a closer look at the tourism data: whilst absolute visitor arrivals illustrate the actual volume of visitors, tourism intensity and density allow for a comparable assessment regardless of population size or area. Length of stay and bed occupancy, in turn, provide further insights into the structure and utilisation of tourism facilities.
Where can you find the new information?
The new maps are available directly in the ‘Maps’ section of IZ Research. There, you can select the various key figures and view them at local authority level.
This transforms a multitude of individual data points into a clear overall picture – up-to-date, nuanced and with the level of detail required for a well-founded analysis of the location.
After all, good location information does not merely answer the question of where something is happening. It also helps to understand why a location is of interest and which factors play a role in this.
You can find the maps here!
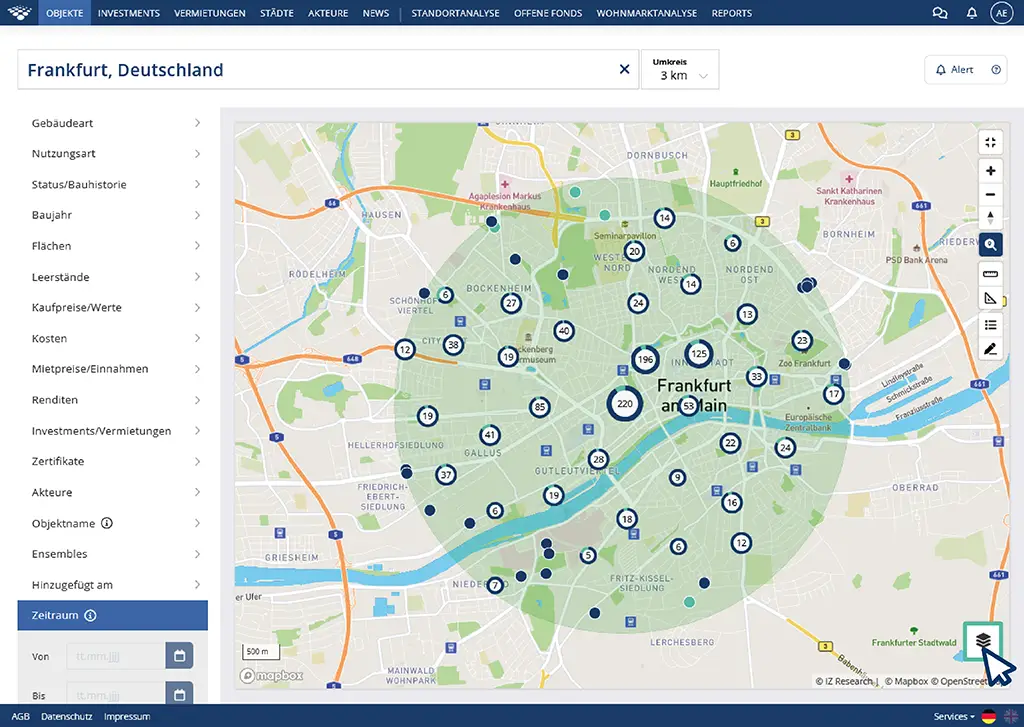
You’ll find the Map Manager, containing all the available thematic maps, at the bottom right of the relevant map view.