With the ‘Open-Ended Funds’ application, you can identify market developments immediately: all key fund indicators, such as returns and market values, are clearly visualised. Thanks to individual area restrictions and precise diagrams, you can see at a glance how regions, asset classes and funds are performing. This allows you to identify trends, opportunities and risks more quickly than with any traditional fund report.
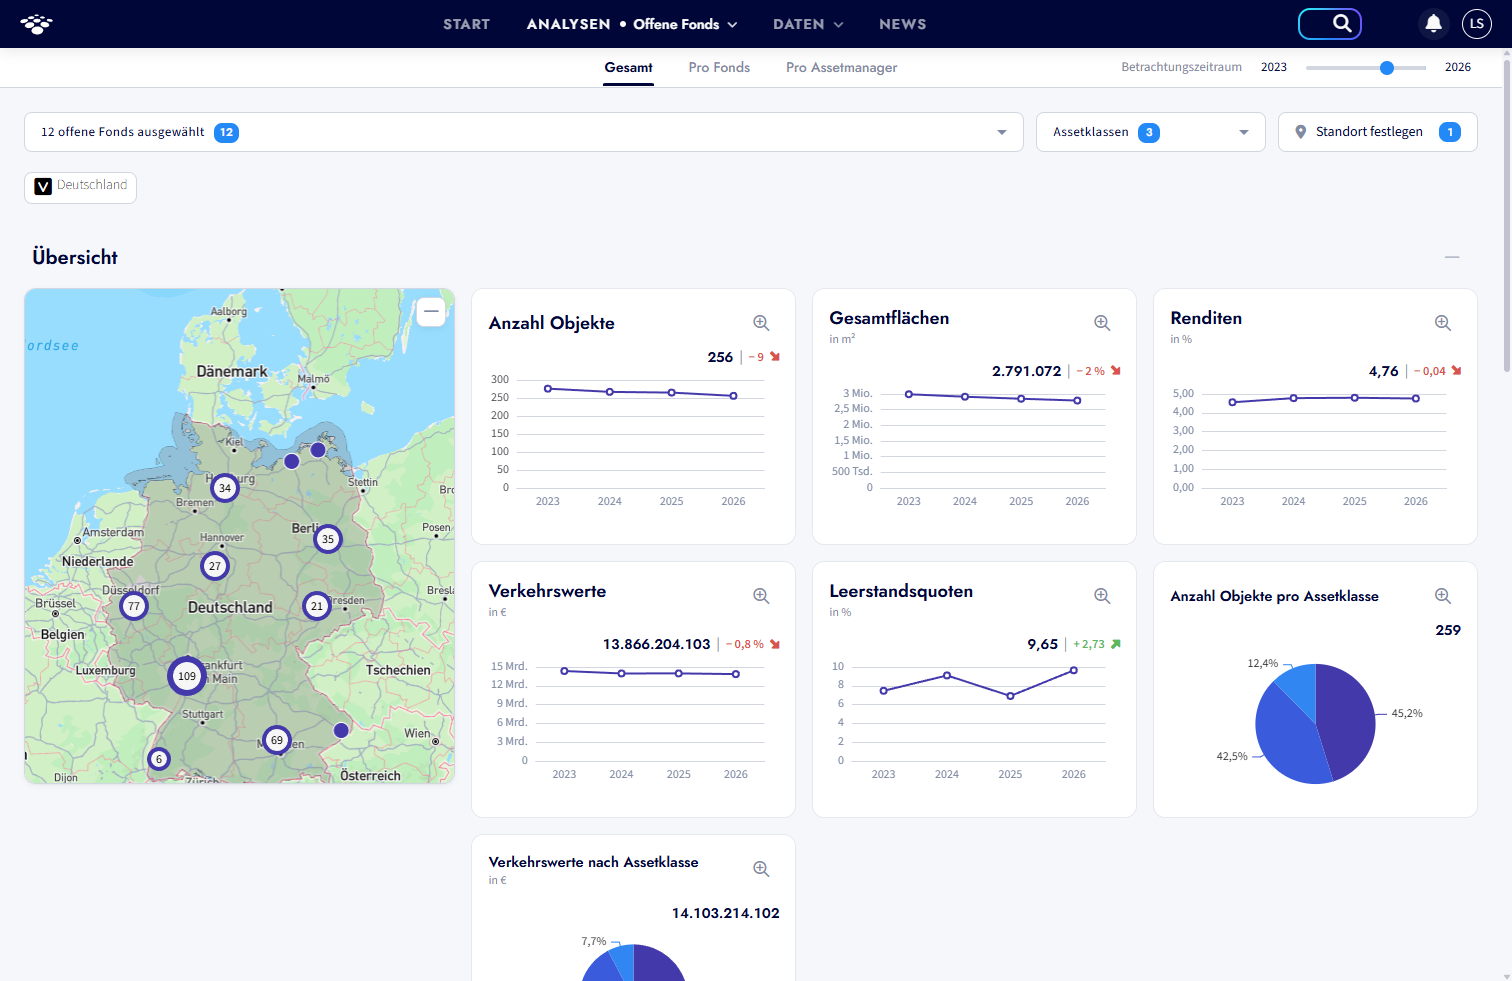
Switch between three perspectives: an overview of the entire market, per fund or per asset manager. Each view provides you with precise insights and helps you to identify correlations more quickly and leverage competitive advantages effectively.
From the number of properties, total areas, and market values to yields, vacancy rates, and rental valuations – all relevant KPIs are visualised over your individually set time frame. Segmentation by asset class and a precise mapping view provide you with a comprehensive understanding of the structure and performance of the funds.
See how the open-ended fund market is developing in your selected area. Select individual funds for the overall market view and display all relevant KPIs as average market values over the set time frame.
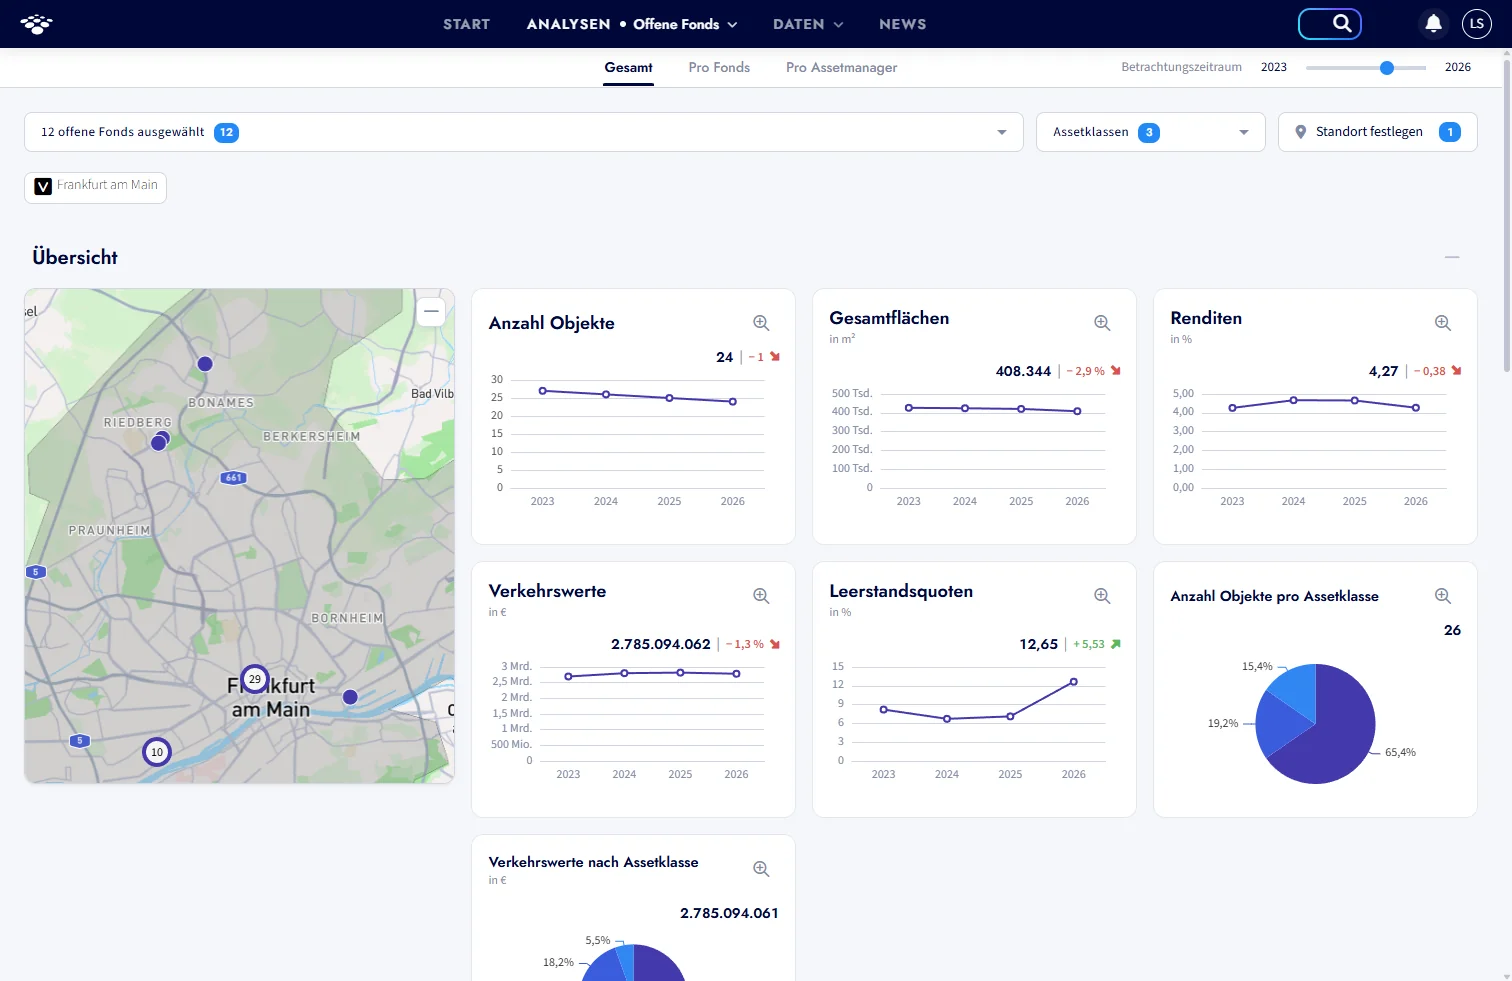
Analyse the performance of a single fund or a selection of different funds in detail. All relevant KPIs are visualised in the individually set time frame.
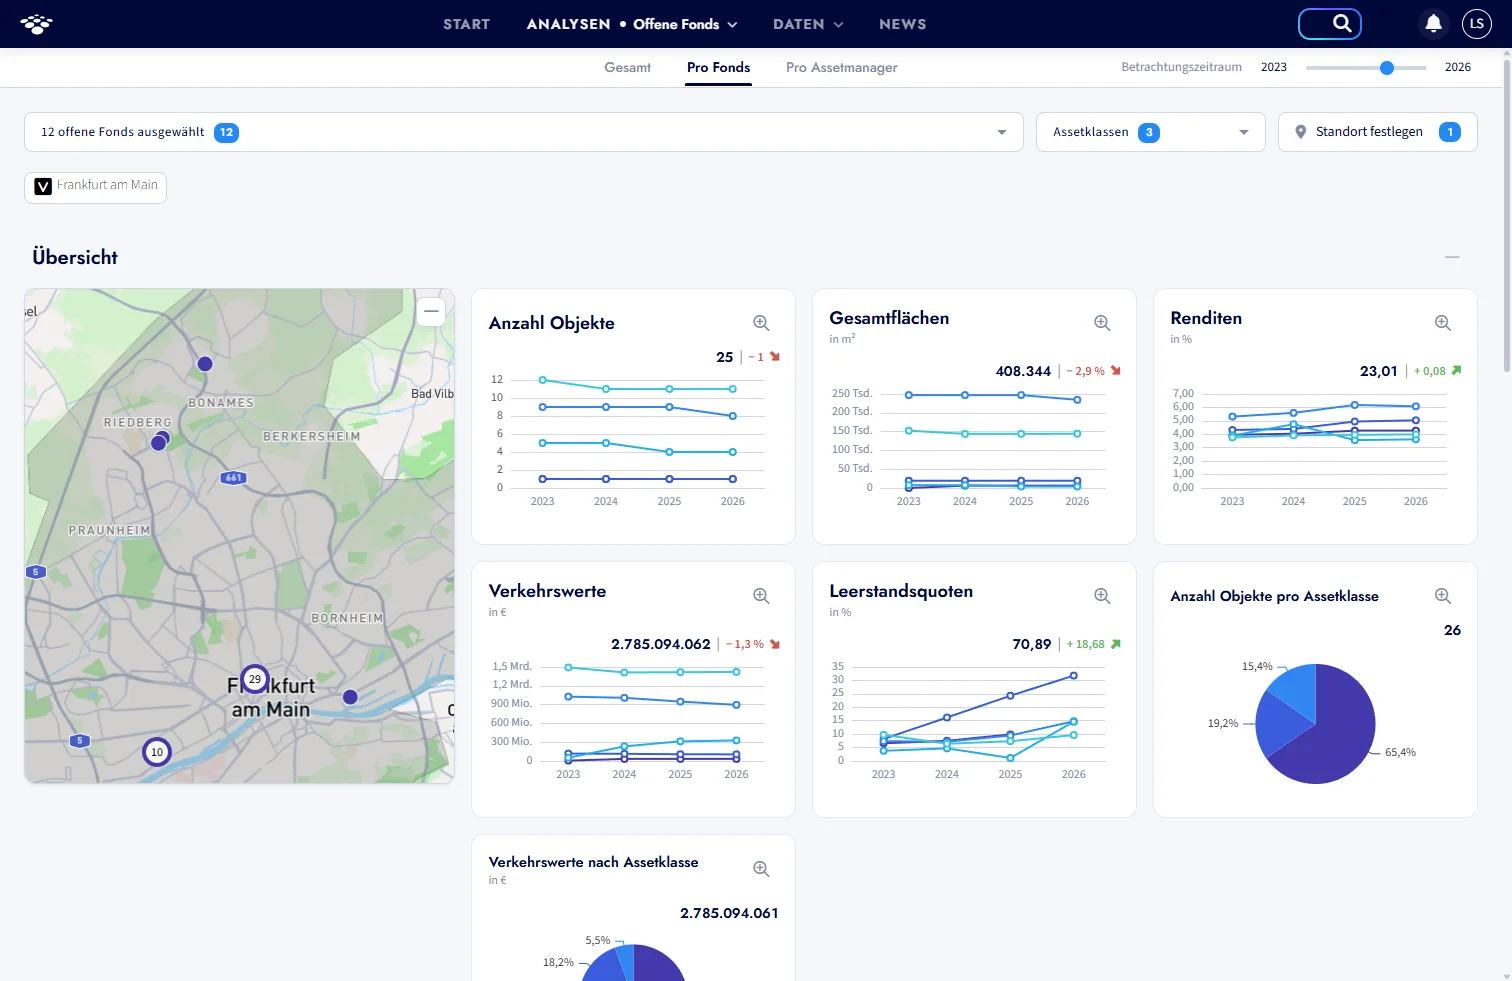
Gain a comprehensive overview of the portfolio development of an asset manager. Relevant KPIs are visualised in the individually set time frame.
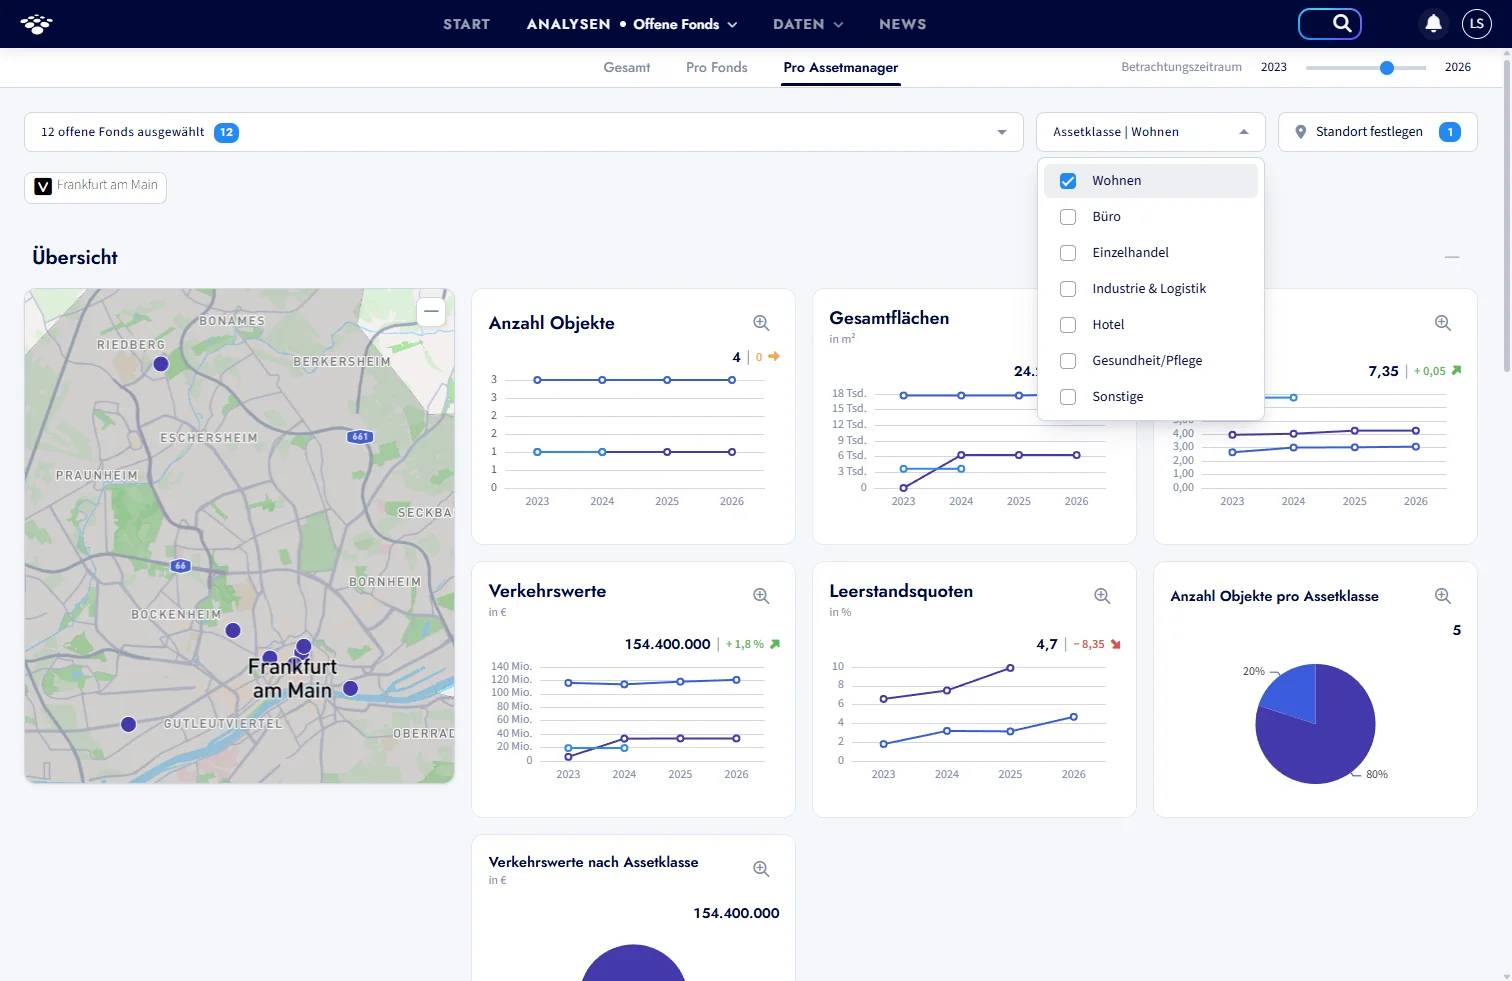
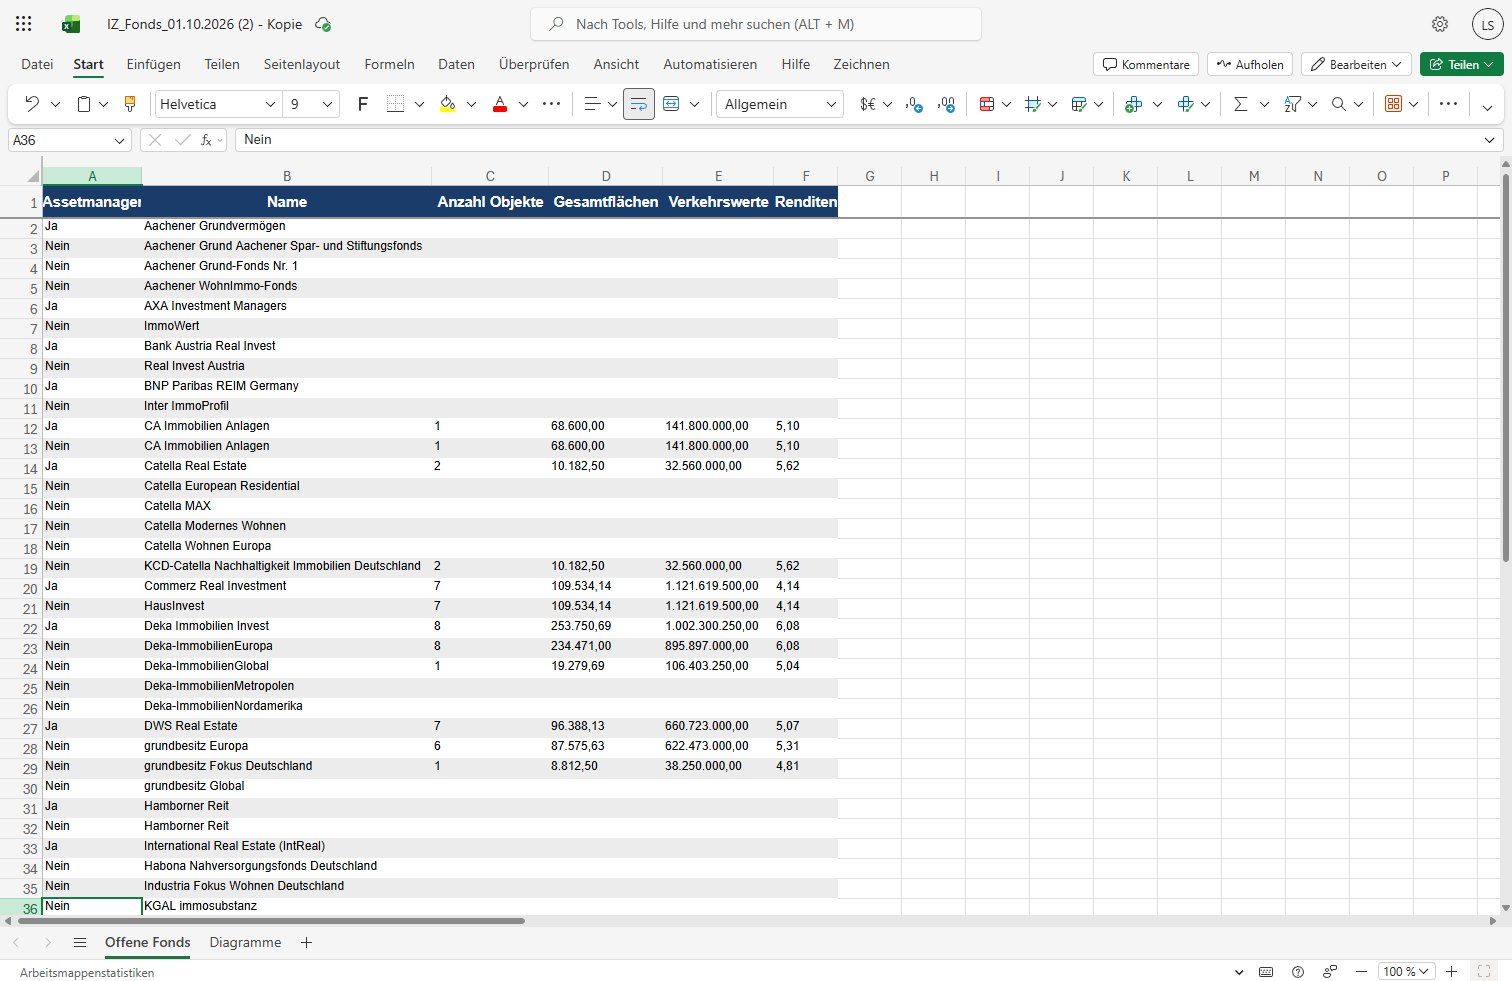
You can export all processed fund data directly from the application as an Excel file. This allows you to seamlessly integrate property lists, KPI overviews and market information into your own analyses, reports or presentations.
You can read more about this feature and all the others in our blog.


