New: Project Development as a Standalone Tool
No time to read? Click here to watch the video.
What’s currently being built or demolished in a region? How much new space will come onto the market in the coming years? And which project developers are particularly active in the area?
With the “Project Developments” tool in IZ Research, you can now answer these questions quickly and clearly. The analysis, which was previously part of the “Location Analysis” application, can now be accessed independently—without having to create a location analysis first.
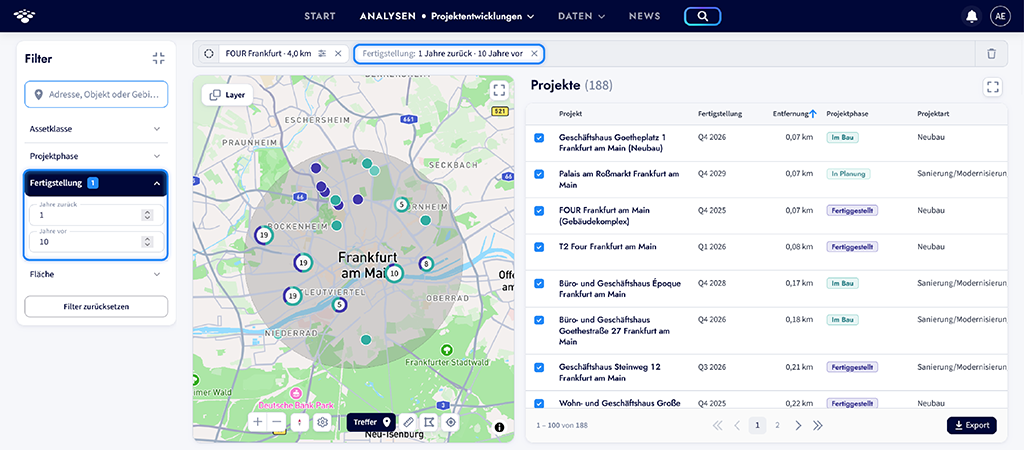
The tool provides a comprehensive overview of planned, ongoing, and recently completed real estate project developments in a freely selectable area.
The results can be viewed from various perspectives:
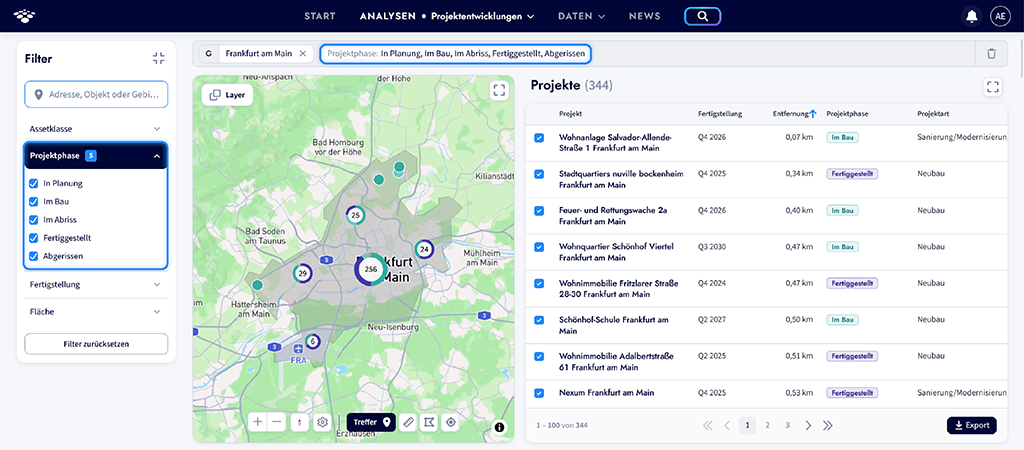
- Map: Where are the projects located?
- Results table: What projects exist, and what is known about them?
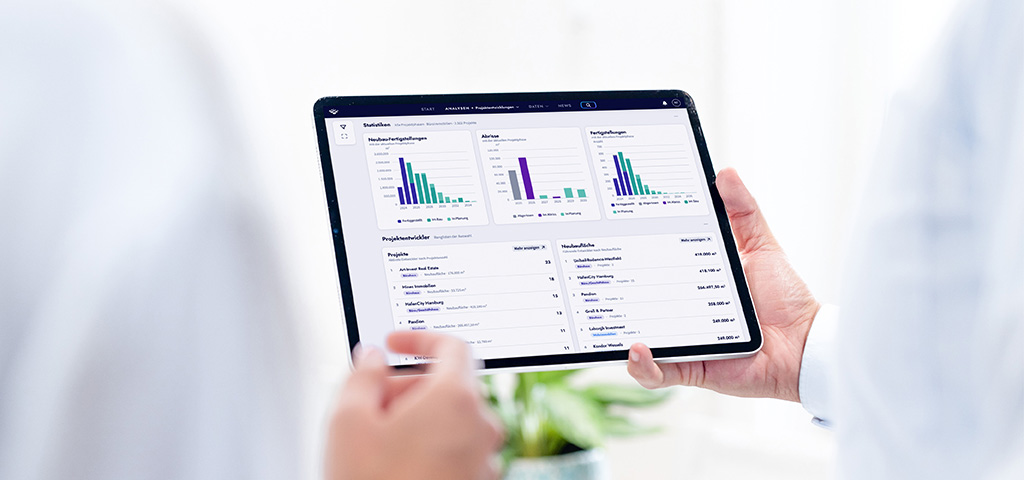
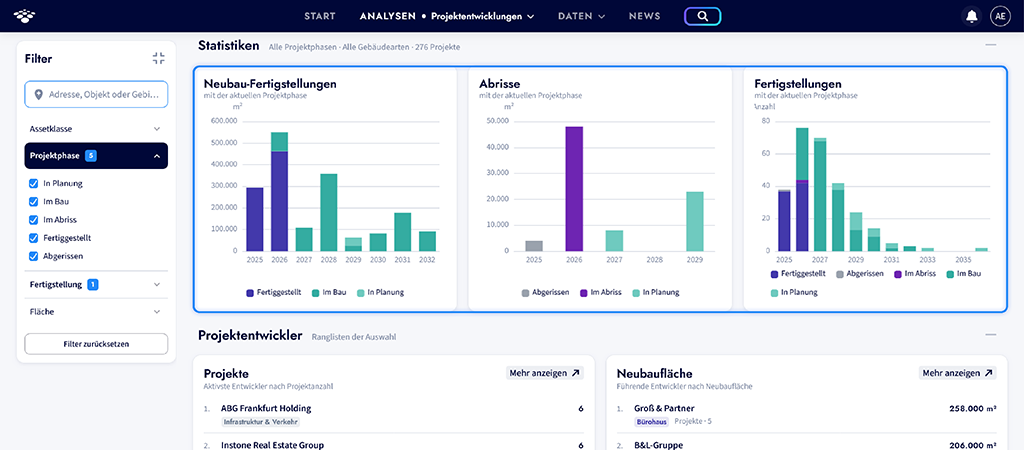
- Statistics: How much space is being completed or demolished?
- Project Developer Rankings: Which developers are represented, and how many projects or how much new construction area do they account for?
- Timeline: When are the individual projects expected to be completed?
The tool covers the entire life cycle of a project development—from planning and construction or demolition through to completion.
How the Analysis Works
It’s easy to use: Select an area, find projects, and analyze the results.
- Select an area: Enter an address, city, or region—or view all of Germany without entering anything.
- Find projects: IZ Research searches the project database for relevant construction projects within the desired completion timeframe.
- Determine project status: The current status is displayed for each project: In Planning, Under Construction, Being Demolished, Completed, or Demolished.
- Evaluate results: Maps, tables, statistics, developer rankings, and a timeline provide different perspectives on development activity.
You can narrow down your selection using filters for project phase, completion date, building type, and area. Individual projects can also be selected or deselected using checkboxes—the results update automatically.
All key project details at a glance
The results table shows, among other things, the project name, completion date, distance, project phase, area, building type, address, and project developers involved. Clicking on the project name takes you directly to the corresponding property details page.
Particularly helpful: The expected completion date is listed, for example, as “Q2 2027.” This makes it easy to see when new spaces will come onto the market.
From Individual Projects to a Market Overview
Things get particularly interesting below the map and table: Three charts show new construction completions in square meters, demolitions in square meters, and the number of completions—all broken down by year and project phase.
Directly below, two rankings provide an overview of the project developers in the current selection—by number of projects and by new construction area. The timeline rounds out the picture, organizing the projects by their completion dates. This makes it easy to see at a glance when specific projects are coming to market.
Where can I find “Project Developments”?
The application can be found in the top navigation bar under Analyses → Project Developments.
Simply select the desired area and then filter by project phase, completion date, building type, and area. The results can be analyzed directly on the map and in the table; below that, you’ll find statistics, project developers, and a timeline.
Good to know: The data comes from the editorially maintained IZ property and project database and is continuously updated. Coverage is nationwide, with a focus on commercial real estate and larger residential projects. Some area figures are estimates.
The analysis is also available in the “Location Analysis” application: There, it can still be incorporated into the final report as a module—including Word export.
Conclusion:
The “Project Developments” application shows at a glance for each area what is currently being built or demolished, how much new space will be added in the coming years, and which project developers are active there—presented as a map, statistics, and a timeline.
Would you like to see for yourself? Then take a look at the following video.