Are you already a subscriber to the Immobilien Zeitung or an IZ Research client?
Click here to create your own personal Housing Market Analysis.
Would you like a guide? Then click here.
A Secure Basis for Decisions
The IZ Research Housing Market Analysis is produced in cooperation with the IIB Dr. Hettenbach Institute. It provides important key figures such as offering prices and sale prices of comparable properties at a glance, as well as information on price development and price ranges (according to house type and year of construction). The offer is complemented by a detailed analysis of the location quality of the property as well as information on the expected duration of the offer.
When buying or selling real estate, it is essential to know the exact value of the property. Based on official calculation procedures, the IIB Dr. Hettenbach Institute has developed the iib Property Reference Value, a method to calculate the current daily value of the property which is empirically sound and based on residential location. The IIB Institute has thus provided a secure basis for decision-making for all participants in the market.
Neu!
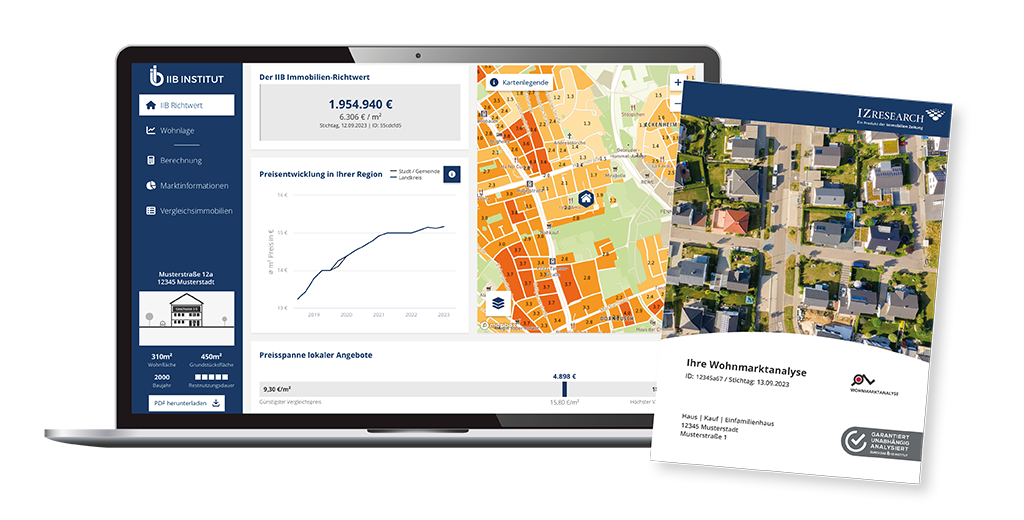
Summary at a Glance
On just a few pages, receive up-to-date important key figures that influence the sale or rental price of your property, such as:
iib Property Reference Value,
Quality of residential location,
Offered prices in the immediate neighbourhood
Price development in the respective city
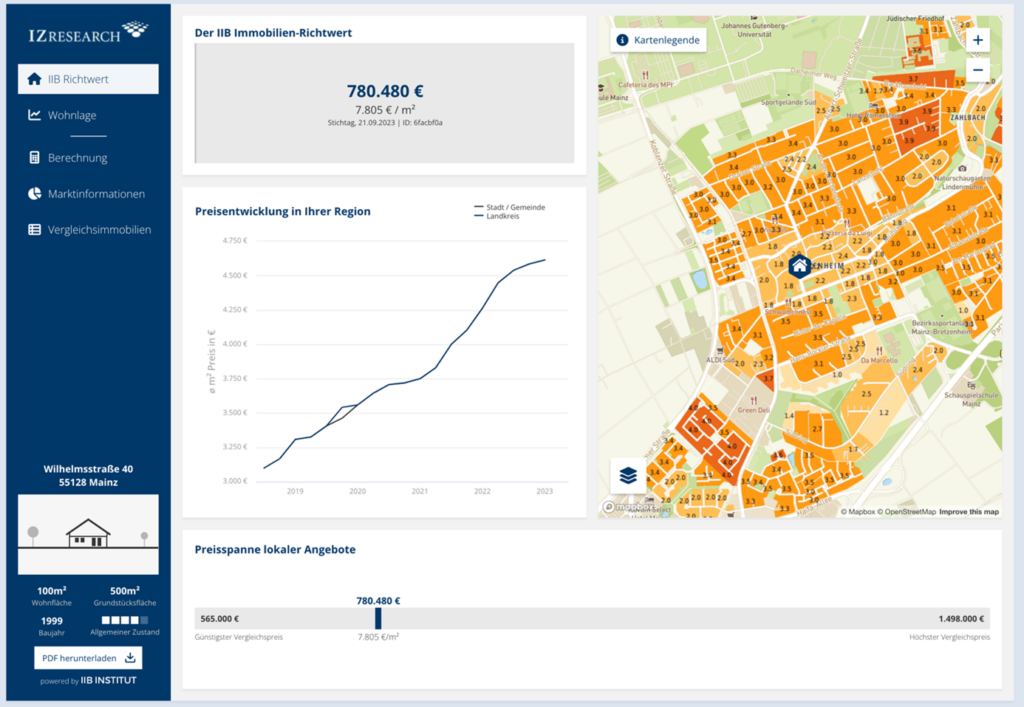
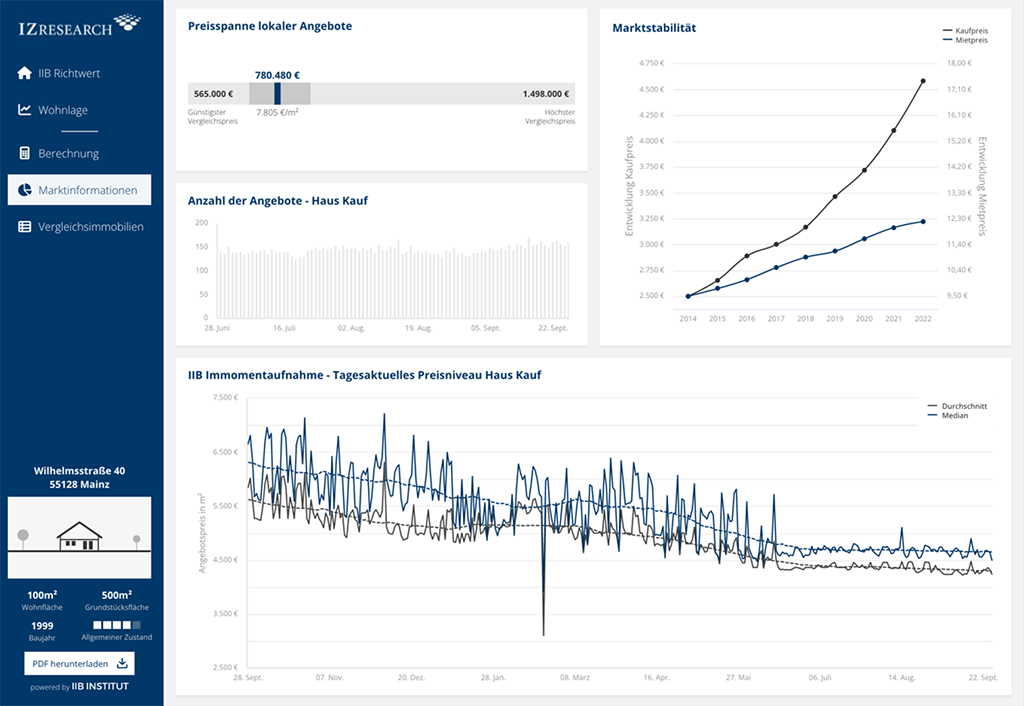
Insight made easy: Interactive dashboard navigation
In the long version of the Housing Market Analysis, the dashboard shows all relevant information about the property at a glance:
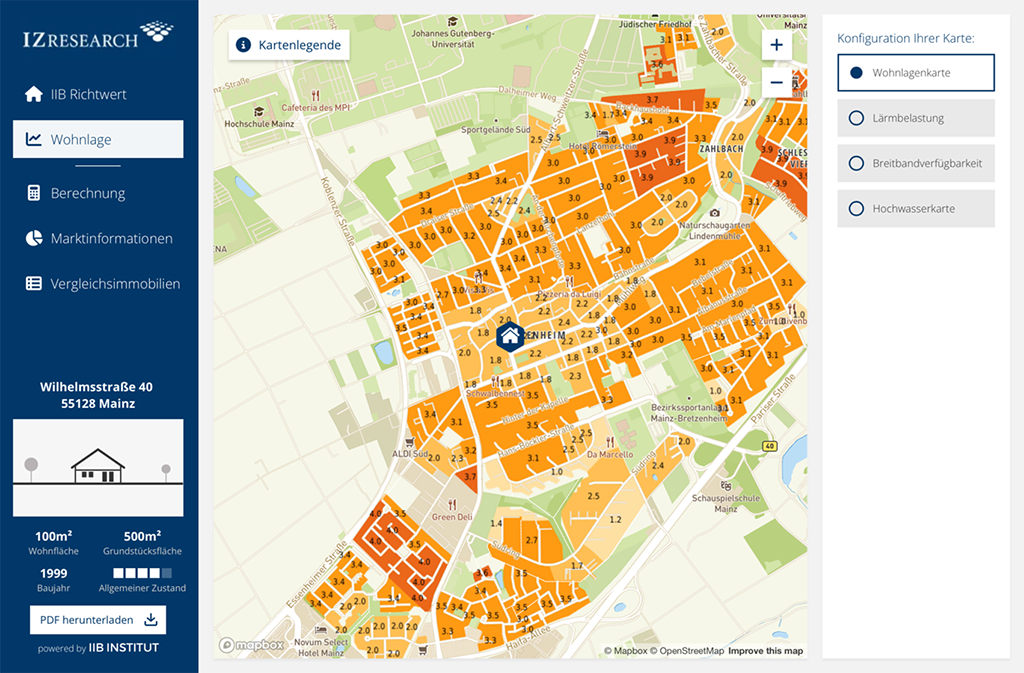
Interactive maps on residential location, local noise pollution, flood hazards and broadband availability
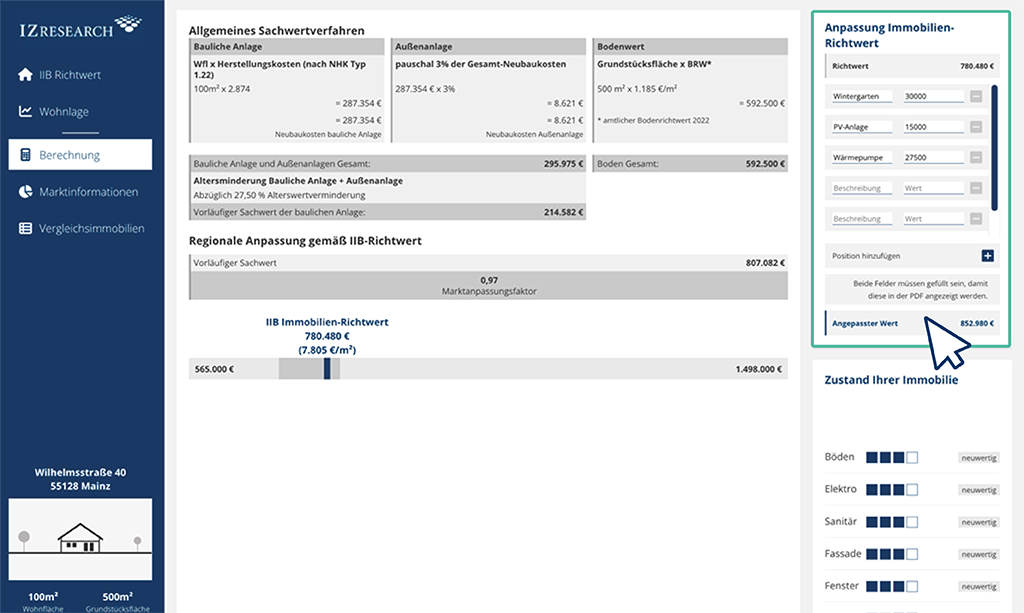
Calculation according to tangible, comparative or capitalized earnings value method