Properties
Compare & Analyse Properties

Icon Bubble Karte Header
Bild eines geschwungenen Gebäudes
properties

Looking for reliable data to evaluate a property?

IZ Research provides essential facts & figures on properties known to us (also in historical order) such as building types, types of use, tenants, brokers / agents and owners. This also includes information such as purchase prices, yields, annual rental income, investment sums, space size, types of use and vacancy rates as well as market and structural data for the respective location.   In addition, you will also receive all the information we have gathered about all other properties in the area, any transaction data known to us and relevant news from the Immobilien Zeitung and our affiliate publications from the dfv Mediengruppe. 
Darstellung Büroteilmarktlage IZ Research Karte
Icon Bubble Transparent

Submarkets

The Submarkets dashboard on the property details page displays the most important published and submarket-related key figures related to a property you are searching for. 
The dashboard displays a table with an overview of the information available while at the same time displaying the location of the searched property within the assigned submarket. Furthermore, the dashboard contains various charts that show the development of these key figures over time and in comparison to the overall market of the respective city. 
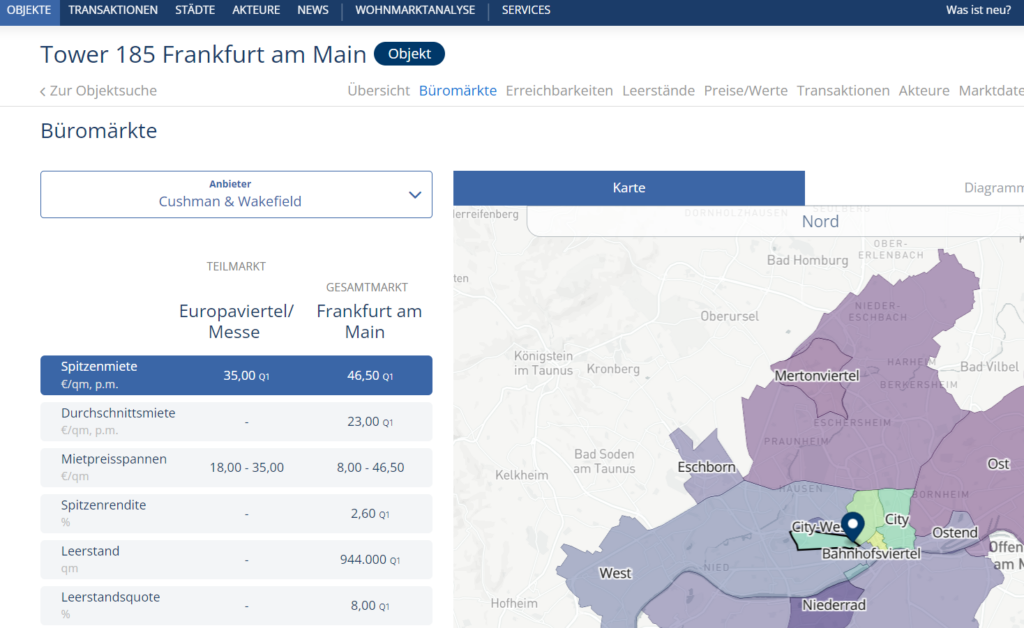
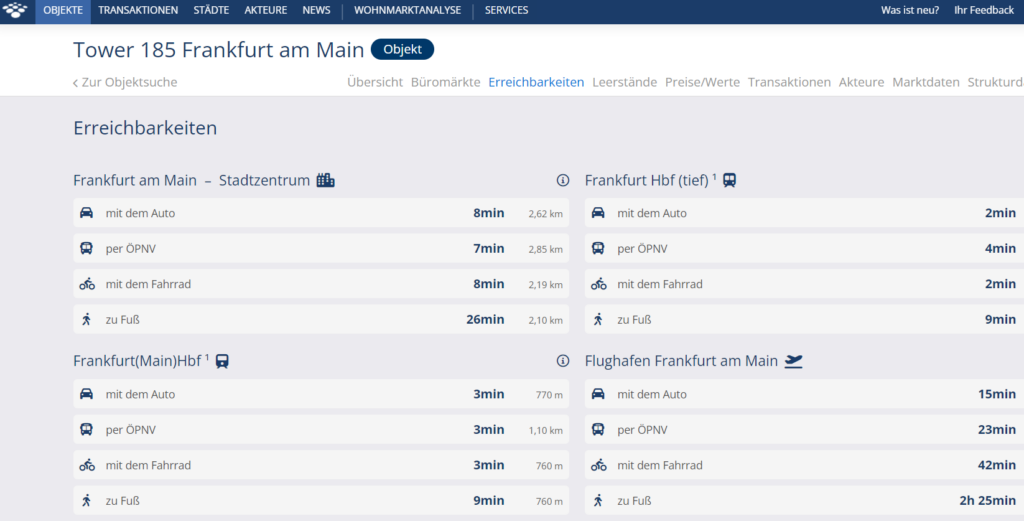
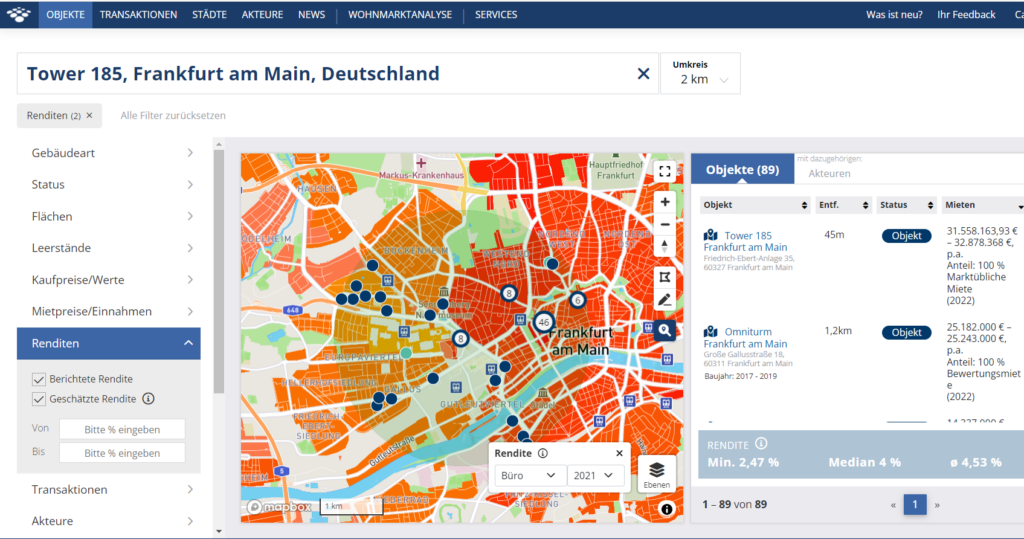
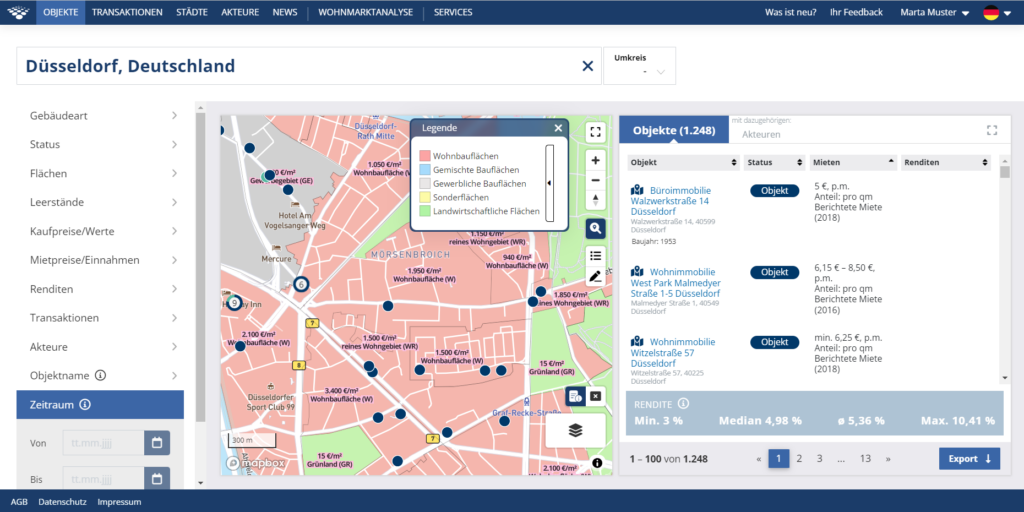
Better assess a property or a potential construction project in relation to the immediate market environment. In addition, determine to what extent the market development within the respective sub-location offers good rental opportunities in the medium term and creates a sustainable yield.  Your benefit: Evaluating the market environment of the property you are searching for is both easier and more precise! 

Travel Times

How far away from a property is the nearest main or regional railway station or airport? And how long is the journey time there using a selected means of transport? Our Travel Times dashboard answers all these questions. Get an overview of the distances and travel times e. g., routes and journey time in minutes, to the most important points of interest (PoI) such as the city centre, the main or regional railway station or the airport.
Icon Bubble Transparent
Screenshot der Erreichbarkeiten des Towers 185 in Frankfurt am Main
New!
Tower 185 Objektdetailseite Übersicht IZ Research
Icon Bubble Transparent

Yield map at submarket level

The yield map on IZ Research uses spatial interpolation to model which property yields could potentially be achieved in a (sub-)market location for the property types office, residential and logistics. Our maps are based on OpenStreetMap to ensure the best possible performance and a wide range of analysis options.

IZ Research
72 h Full Access

Contact our Sales team today to receive free access to all IZ Research applications and features for 72 hours. 

IZ Research
72 h Full Access

Request your free 72-hour access to IZ Research now, with no obligation to buy. You will receive access to all applications and functions.