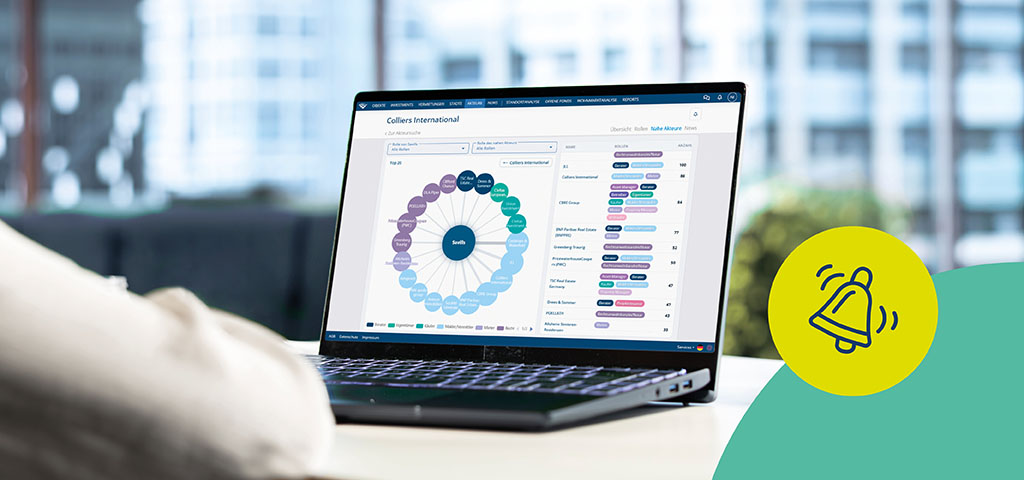
How are people talking about a company, a property or a location? Until now, to find this out, you had to read every relevant news item. The new sentiment timeline in IZ Research puts an end to this time-consuming research – and shows the market sentiment at a glance.
What does the sentiment trend show?
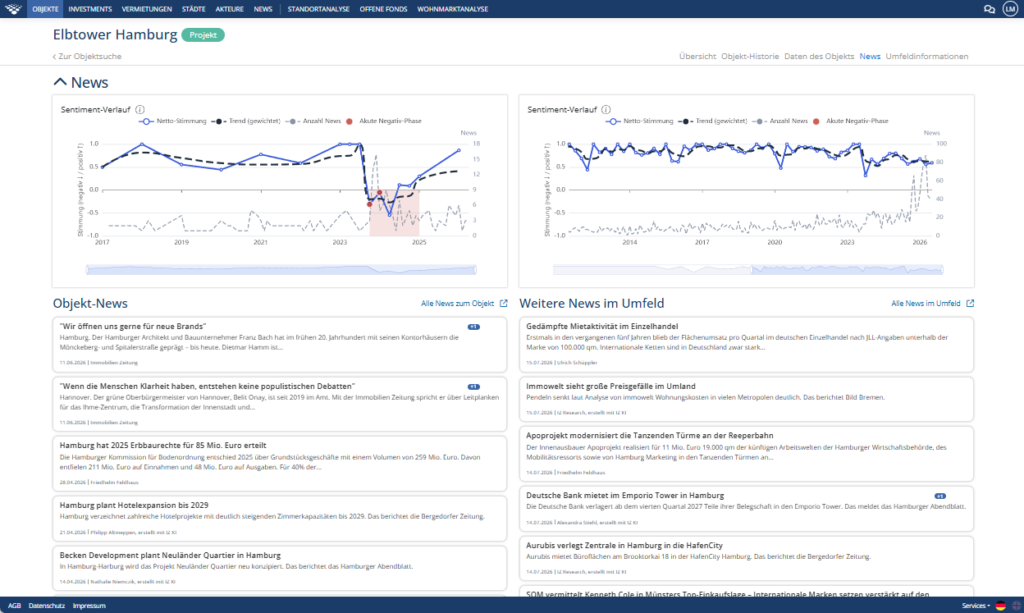
The sentiment trend summarises the tone of media coverage relating to a company, a property or a location over time. The net sentiment is displayed as a line and supplemented by a trend line that gives greater weight to periods with a high volume of articles. This means that a widely reported crisis becomes visible quickly, rather than appearing late and in a diluted form on the graph. Prolonged negative phases are highlighted in red. The time period covered by the graph can be flexibly adjusted and narrowed down.
The graphs in detail
The sentiment trend consists of different graphs. Here is what they show in detail:
- Net sentiment: Net figure for each period = (positive − negative articles) ÷ total number, normalised to a range of −1 to +1.
- Trend: a smoothed average across several time periods, weighted by the number of articles. Time periods with a large number of articles carry greater weight. This means that, when there is a high volume of news, the trend rises rapidly rather than being dragged down by quieter periods.
- Number of news items: Shows how many articles were included in the sentiment analysis each month. Fewer articles mean the figures are less robust.
- Phases highlighted in red: These indicate a persistently negative sentiment (the trend is below zero).
- Acute negative phase: Illustrates specific periods characterised by a negative sentiment and a conspicuously high number of articles. This is seen as an indication of acute, widely reported negative outcomes.
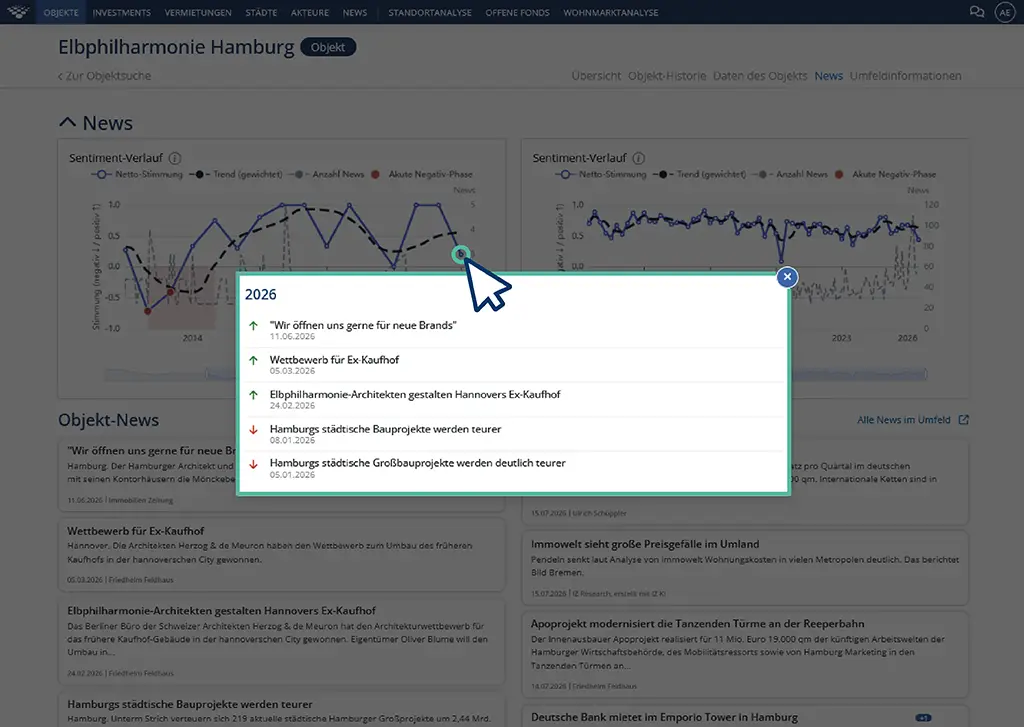
Tip: Click on a point on the sentiment timeline to view the underlying articles.
How the rating is calculated
The basis is a domain-specific dictionary of positive and negative terms for the property sector. It is created with the support of AI-powered analyses of large volumes of property news and is continuously refined. The assessment is then carried out in a transparent manner: each news item is categorised based on the terms it contains, including words that alter the meaning of a statement, such as negatives or phrases like ‘but’. Events that have different impacts on the parties involved are also identified: if one company takes on staff from another, this is a positive signal for one side and a negative one for the other.
Keeping an eye on sentiment, from market participants to the location
Sentiment trends can be applied not only to companies, but also to individual properties and locations, such as a high-profile construction project like the Elbtower. A distinction is made between sentiment towards the property itself and sentiment in the area surrounding the property. This distinction is often crucial when assessing the location.
From the big picture to the details: see what’s being assessed
To provide as comprehensive a picture of sentiment as possible, the data set includes not only the *Immobilien Zeitung*’s own reporting but also an editorially curated press review of external sources.
You can view which news items are included in the analysis at any time by clicking on the relevant sentiment point.
Who can benefit from the sentiment?
Anyone who needs to keep track of numerous companies, properties or locations can use the sentiment history to gain a quick overview without having to read every single news item. Here’s how you can put the sentiment history to practical use:
- Investors: Before making an investment, check how a company or a property is portrayed in the media, even over a period of several years. The crisis points immediately reveal whether there have been periods of widespread negative coverage.
- Banks and lenders: As part of a lending process, do you with to track the sentiment surrounding a borrower or a property being financed over time? Increased reports of payment difficulties, changes in management or an impending takeover. Use these indicators in your due dilligence process.
- Real Estate Agents and Brokers: See at a glance how public perception of a particular area has developed over recent months and use this information to market your properties.
- Project developers: You can see directly in the timeline how an area or a project is perceived in the press, to assist with your site assessment.
- Surveyors and valuers: Organise the news coverage relating to a property or company in a clear and traceable manner. You can read individual news items in detail any time, if required.
- Family Offices: Gain a quick overview of all positions in your portfolio without having to check every report individually for the period in question.
Get an overview of the sentiment in your market environment right now in IZ Research.
Conclusion
The sentiment timeline condenses media coverage into a clear sentiment curve. Anyone wishing to know how a particular player or location is perceived in the media no longer needs to read every single news item. Instead, the timeline shows the trend at a glance – and, if required, the underlying articles are just a click away.