
Our summer release is live, introducing a yield map at sub-market level and a breath of fresh air to the entire map landscape!
The new yield map on IZ Research now uses spatial interpolation to model which property yields could potentially be achieved in a (sub-)market location for the property types office, residential and logistics. As part of the yield map release, our maps in IZ Research have also been converted to an OpenStreetMap basis, which, in addition to improved performance, offers more diverse analysis options.
New yield map provides greater transparency in (sub-)market locations
The German real estate market is intransparent and accessibility to the most important KPIs that define the profitability of a property is still limited. In particular, information on the property-relevant yield is only occasionally available. However, the yield is the most important KPI that describes the performance evaluation of a financial investment and helps to map the price development in local real estate markets or in submarkets.
In order to gain more understanding of the large number of unknown property yields and to be able to depict a price structure of micro-locations, spatial interpolation methods can help, by means of which spatially referenced data can be analysed. In concrete terms, this means that on the basis of known property yields, the yields for properties located in the surrounding area or in the same sub-area are estimated and the results are displayed on a map. Our yield map thus provides a basis for assessing the value development of a submarket or a micro-location.
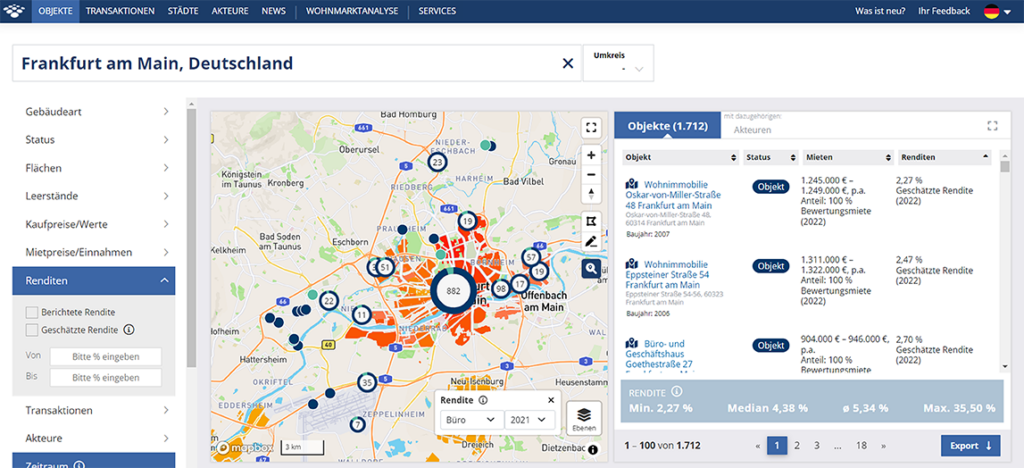
How can I access the yield map?
Simply click on the “Level” icon, which you will find in the bottom right-hand corner of all map views in IZ Research. Select the “Yield” icon there and then filter by type of use (office, logistics, residential) and reference year.
What interpolation methodology is used and how does the procedure work?
The IZ Research yield map displays the value of a submarket/urban area by means of geostatistical interpolation based on the IDW (Inverse Distance Weighted) interpolation method. The basic assumption of this interpolation method is a spatial similarity between the individual neighbouring values in the sense that data points that are spatially close to each other show a higher similarity than data points that are far away from each other. The quality of the interpolated results depends on the accuracy, the number and the distribution of the data points used in the calculation. The procedure is mainly based on the inverse of an exponentiated distance and assumes that an assigned value loses influence with increasing distance from the reference point in the calculation of the mean values. In the IDW method, the yield of properties for which no values are known is estimated using a linearly weighted combination of a number of known yields. The accuracy is calculated as RMSE (Root-Mean-Square-Error), as an average over 5 runs with randomly selected comparable properties.
As a comparative data basis, we use the gross yield determined by IZ Research, which is derived from the published valuation rent on the reporting date and the market value of a property, since a sufficiently high number of cases of known data points are available for calculation.
With this procedure, the yields can be interpolated for any geographical point data in the market area. In addition to a fast calculation (especially when new yield values are added), the method offers the advantage that different distances from the starting point or value can be weighted differently in the interpolation and finely adjusted with the help of the distance weighting exponent.
Our new map now offers improved analysis options thanks to OpenStreetMap
In the course of the release, we have converted our maps in IZ Research to OpenStreetMap, which are made available via Mapbox. Based on the open source service of OpenStreetMap, Mapbox offers very good usability and strong performance when loading and using the maps, as well as helpful tools for visualising georeferenced data.
The drawing and saving of self-defined market areas (polygons) is also available in the new map edition. Furthermore, it is possible to switch between a map or satellite background.