
The new “Submarkets” dashboard on the property details page in the “Properties” feature, is a dashboard we have developed which enables users to display the most important published and submarket-related key figures in the context of a property being searched for- initially for the office use type in the seven A-class cities as well as 14 other cities throughout Germany.
“Geospatial market analysis plays a crucial role for all real estate players because, as we know, a property can only really be valued in relation to its environment and its location. Therefore, we know only too well that well-prepared geodata with a real estate reference can significantly simplify the analysis with market and property data, especially when looking at the micro level,” says Ingeborg Maria Lang (Head of Digital Research IZ Research).
“As a result, in recent months we have worked with our product development team to develop a dashboard on the property details page in the “Properties” feature, which displays the most important published submarket-related key figures in the context of a particular property that is being searched for,” Lang continues.
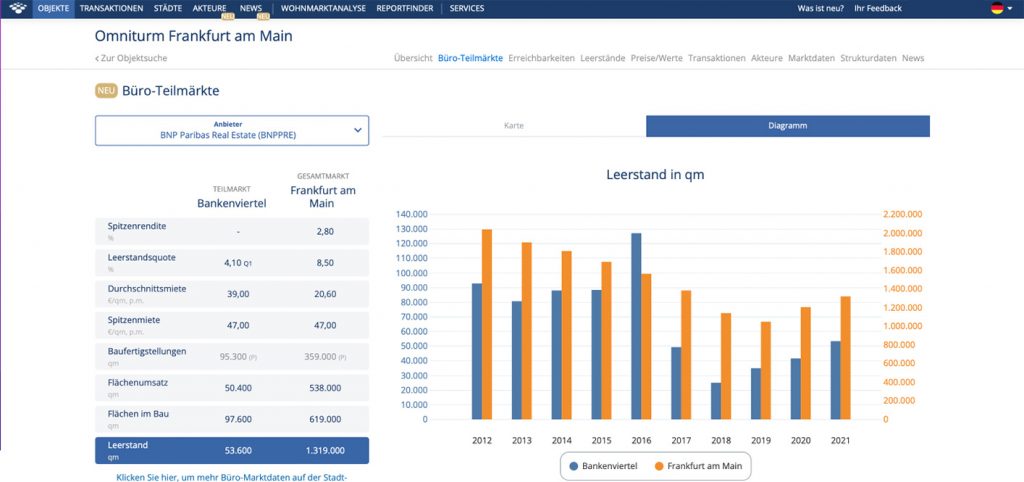
On the one hand, the dashboard displays a table containing an overview of the available information while at the same time visually displaying the location of the searched property within the assigned submarket in the form of a map. Furthermore, the dashboard contains various charts that show the development of these key figures over time and in comparison to the overall market of the respective city. In this way, data and location within a submarket are brought together in a way that can simplify the evaluation of the market environment of the property in question.
Using the new dashboard enables a better classification and assessment of the property or a potential construction project in relation to the narrower market environment. In addition, it’s possible to determine to what extent the market development within the respective sub-location offers good letting opportunities in the medium term and thus provides a sustainable return.
The dashboard on the details page of IZ Properties initially includes a presentation of the published office submarkets, supported by data from at least three sources for the seven A-class cities (Berlin, Düsseldorf, Frankfurt, Hamburg, Cologne, Munich and Stuttgart) and at least one source for nine B-class cities (Bonn, Dortmund, Dresden, Essen, Hanover, Karlsruhe, Leipzig, Mannheim and Nuremberg), and the four C-class cities of Braunschweig, Heidelberg, Magdeburg and Potsdam as well as Ludwigshafen.
Are you interested in taking a closer look at our products or testing them? Please contact our sales department directly at www.iz-research.com/contact