
The option of being able to draw your own market areas (polygons) on the IZ Properties map provides our clients with a useful tool in Version 4.4 of IZ Research, which can help them to significantly optimise their market and property analysis.
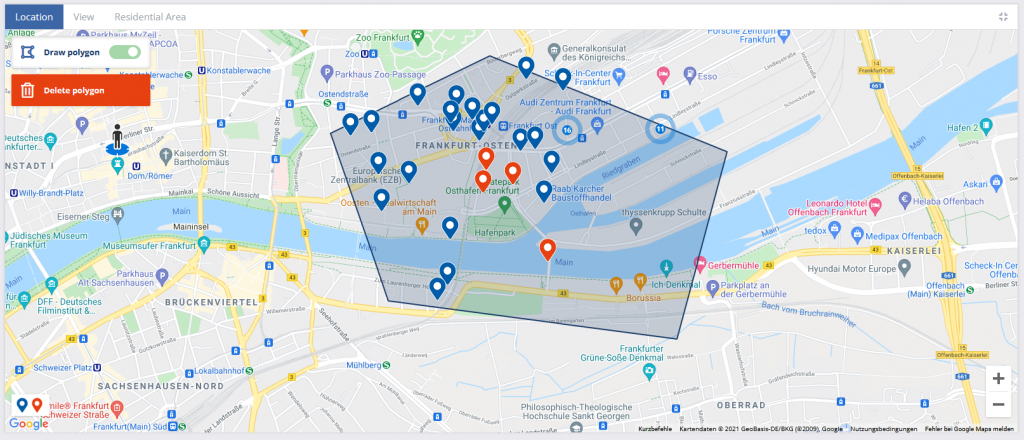
And this is how it works: On the IZ Research map in IZ Properties you can see the map element “Add market area”. If you activate the toggle, you can draw an area (polygon) by defining the individual points as the boundary of the area with a mouse click. The line/polygon follows your clicks. Double-click to complete the area. You then see an overview of properties/projects in the result list in your selected area.
The filter functions, e.g., searching for a certain type of building or limiting the building area, perform as usual and select the choice in your drawn area (polygon) and are displayed in the result list. You can then export the list as usual.
And here’s another preview of what’s to come: In the next development stage, “Iteration”, you will be able to assign a name/description to your self-drawn market areas, save them and visit them again at any time. This functionality will be implemented in the coming weeks.
This will provide our clients with another tool for optimising an individual property analysis.