
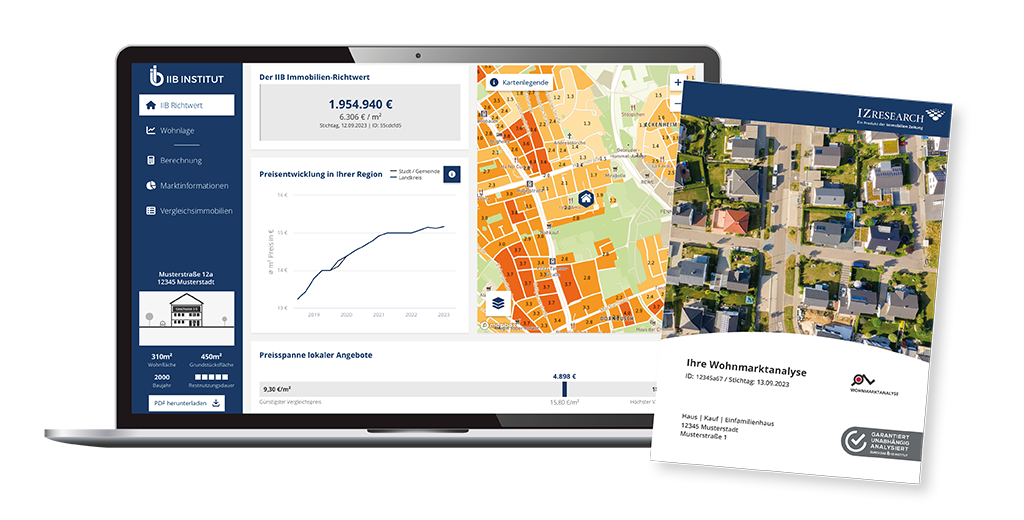
The new version of the Housing Market Analysis is here – now even more user-friendly and informative!
The Housing Market Analysis now has a new look and offers you an interactive display of your analysed property for improved understanding and error-free entries.
The interactive dashboard shows all relevant information about the property at a glance. It has been supplemented with the residential location map and specific maps on noise pollution and broadband availability in the location you are looking for.
Tip: All dashboard content can also be exported as a PDF.
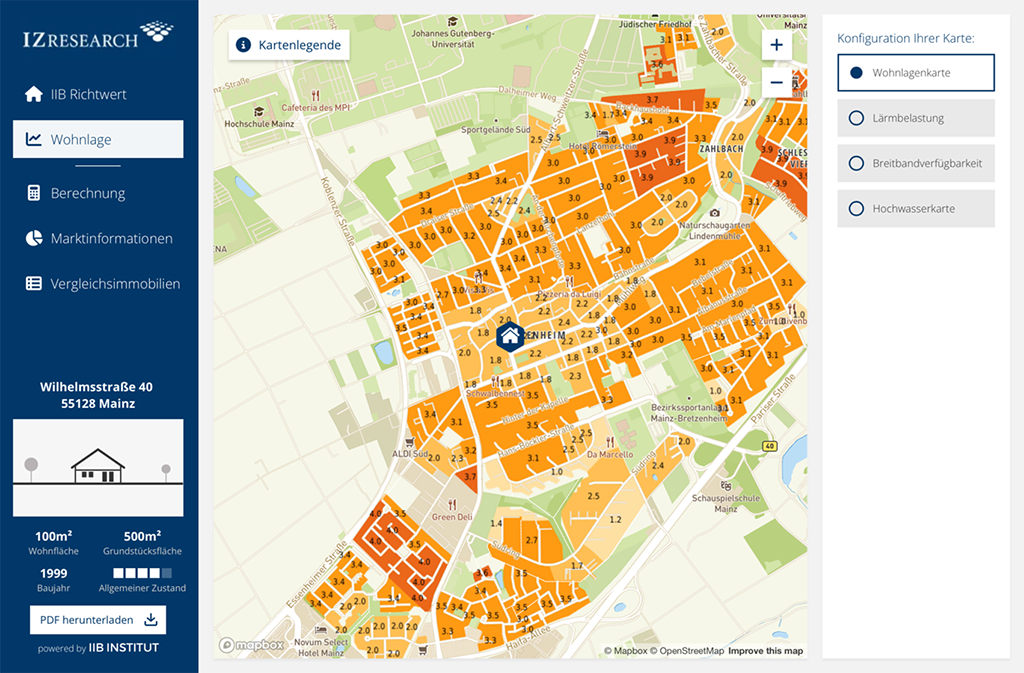
Easy to understand: The interactive dashboard navigation
In the long version of the housing market analysis, the dashboard shows all relevant information on the property at a glance:
- IIB Property Reference Value
- Residential location map and additional specific maps on noise pollution, broadband availability and flood hazards
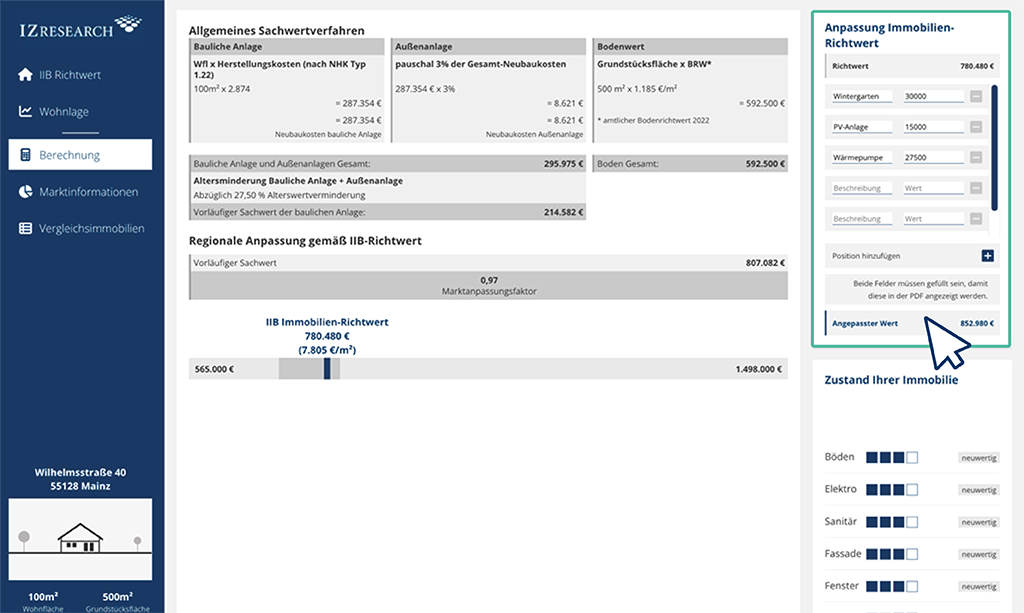
- Calculation according to the asset value, comparative value or capitalised earnings value methods
- Market information
- Comparative properties
- PDF download
The IIB Property Reference Value in the dashboard
- Calculations broken down transparently according to the comparative value, asset value or capitalised earnings value method
- Detailed presentation of the condition of the property
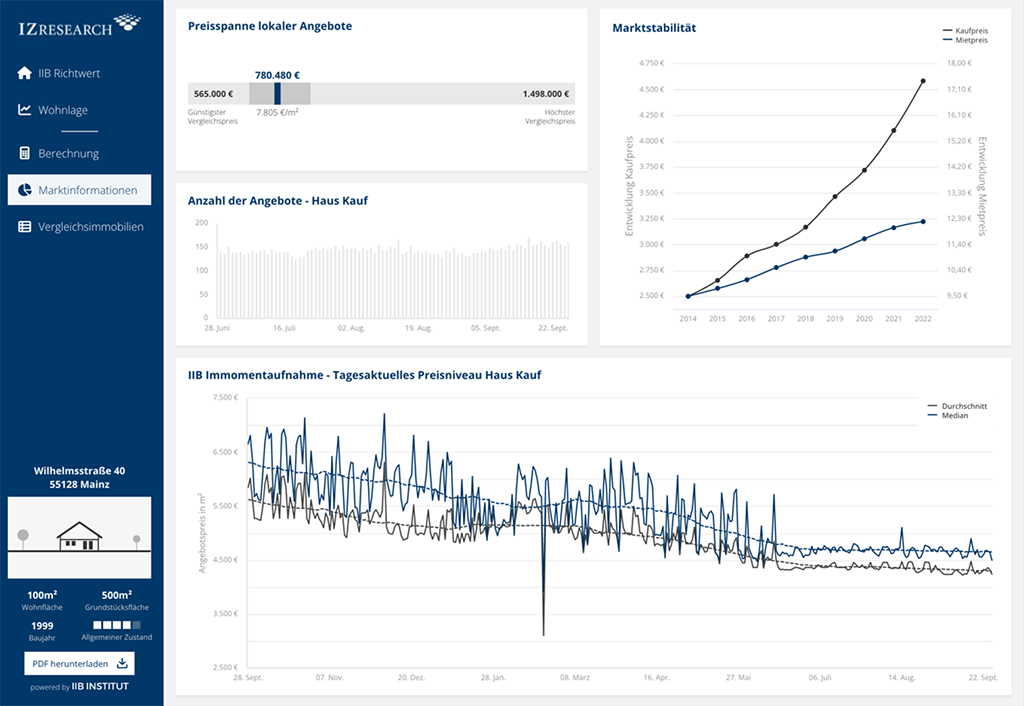
Market information
This menu item in the dashboard provides you with:
- Current development of the market
- Price range of local offers
- Market stability
- Current development of supply
- Daily development of rental or purchase prices
Comparable properties
- Top 8 comparable offers from the immediate vicinity
- Top 8 comparable offers used for analysis in list view
- Location of the properties on the residential location map